Today I stayed after school to create some anchor charts my regular 7th grade math classes. We are currently working on 7.EE.A.1 "Apply properties of operations as strategies to add, subtract, factor, and expand linear expressions with rational coefficients." All my math students did ACT Interim testing today so I spent some time designing my anchor charts. I'm a bit compulsive when designing anchor charts and prefer to map out what I want to include on post-it notes and then transfer the information to chart paper. I don't decide on colors until I sit down to write my anchor charts. These three (well really four because I redid the Solving Expressions chart) took me over two hours to complete.
Below was the first chart I created. I was definitely not happy with how the examples looked. I should have had space between each line on example 2.
 |
| Solving Expressions Take One |
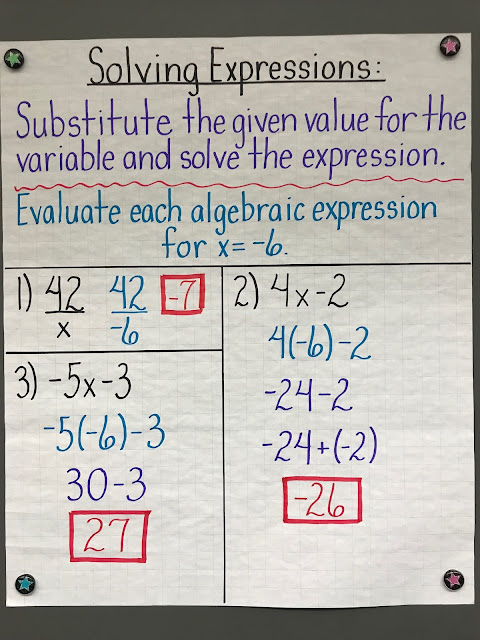
I ended up redoing this chart after I created the charts for Distributing and Factoring. I thought they were so much easier to read and see each example that I went back and and fixed this one up and was much happier with how it turned out the second time.
 |
| Solving Expressions Much Better! |
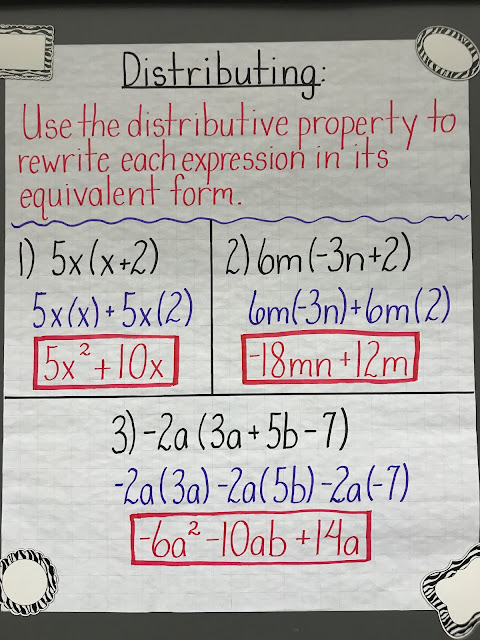
I do not require my students to show the work of how they distribute, but put it on the anchor chart as a guide to remind them they have to distribute to all terms in parentheses. A common misconception is for them to only distribute to the first term.
 |
| Distributing |
I love the way this chart turned out and like the combo of blue, red, and purple with the black. Stepping outside my comfort zone of my pink, blue, green color scheme. When students struggle I always refer back to the anchor charts to guide them to solve the problem.
 |
| Factoring |
All ready to go on my front board for tomorrow.


Wow! I've been wanting to start making more anchor charts this year and your post is inspiring me to do that on Monday!
ReplyDeleteThanks! Good luck with the anchor charts. I find it very helpful to preplan them on post-its in my composition notebook.
ReplyDelete